Nvidia GeForce GTX 1050
GTX 1050 Price History & Tracker (US)
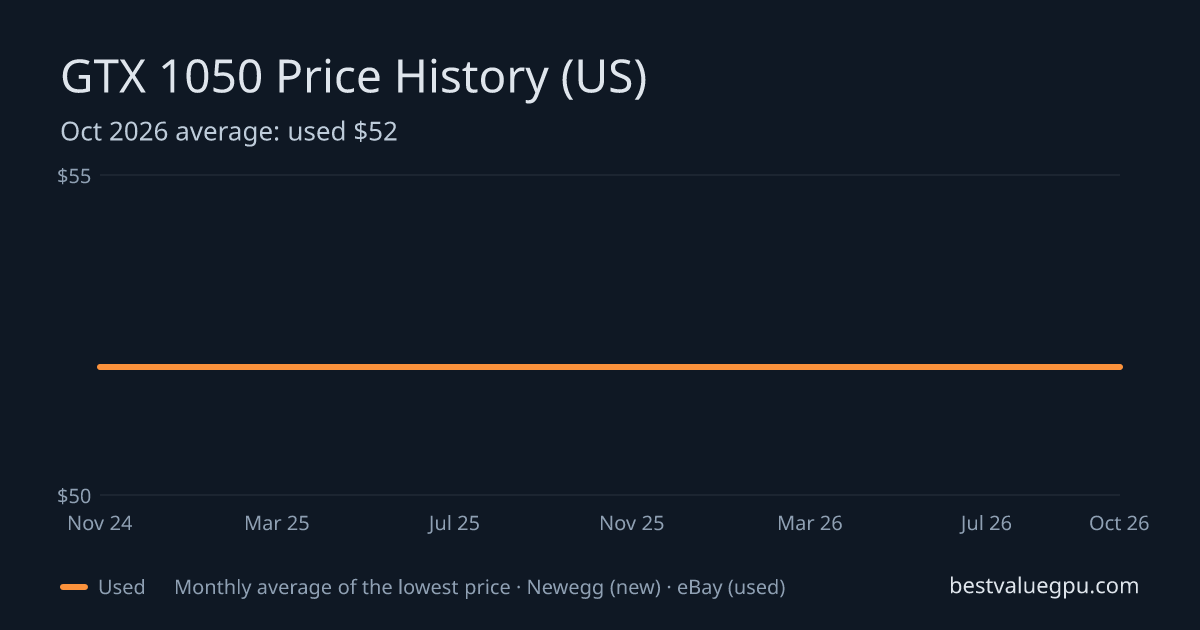
Price History Chart
The chart shows the typical (median) lowest daily price of new GPUs on Newegg and used GPUs on eBay, per month, or per week in the 6-month view. One-off mis-listed prices are filtered out.
GTX 1050 Price History Table
Typical (median) lowest daily price in each month, newest first. Δ is the change from the previous month in $.
| Month | New | Δ | Used | Δ |
|---|---|---|---|---|
| Nov 2026 | ||||
| Oct 2026 | $52 | 0 | ||
| Sep 2026 | $52 | 0 | ||
| Aug 2026 | $52 | 0 | ||
| Jul 2026 | $52 | 0 | ||
| Jun 2026 | $52 | 0 | ||
| May 2026 | $52 | 0 | ||
| Apr 2026 | $52 | 0 | ||
| Mar 2026 | $52 | 0 | ||
| Feb 2026 | $52 | 0 | ||
| Jan 2026 | $52 | 0 | ||
| Dec 2025 | $52 | 0 |
Show 32 earlier months (Apr 2023 – Nov 2025)
| Nov 2025 | $52 | 0 | ||
| Oct 2025 | $52 | 0 | ||
| Sep 2025 | $52 | 0 | ||
| Aug 2025 | $52 | 0 | ||
| Jul 2025 | $52 | 0 | ||
| Jun 2025 | $52 | 0 | ||
| May 2025 | $52 | 0 | ||
| Apr 2025 | $52 | 0 | ||
| Mar 2025 | $52 | 0 | ||
| Feb 2025 | $52 | 0 | ||
| Jan 2025 | $52 | 0 | ||
| Dec 2024 | $52 | 0 | ||
| Nov 2024 | $52 | 0 | ||
| Oct 2024 | $52 | 0 | ||
| Sep 2024 | $52 | 0 | ||
| Aug 2024 | $52 | 0 | ||
| Jul 2024 | $52 | 0 | ||
| Jun 2024 | $52 | 0 | ||
| May 2024 | $52 | 0 | ||
| Apr 2024 | $52 | 0 | ||
| Mar 2024 | $52 | |||
| Feb 2024 | ||||
| Jan 2024 | ||||
| Dec 2023 | ||||
| Nov 2023 | ||||
| Oct 2023 | $52 | 0 | ||
| Sep 2023 | $52 | +2 | ||
| Aug 2023 | $50 | −2 | ||
| Jul 2023 | $52 | −3 | ||
| Jun 2023 | $55 | +4 | ||
| May 2023 | $51 | −4 | ||
| Apr 2023 | $55 |