AMD Radeon RX 7900 XT
RX 7900 XT Price History & Tracker (UK)
The RX 7900 XT costs £746 used on eBay today. That is 45% above its 12-month average of £514 and 14% below the £863 launch price.
Price History Chart
The chart shows the typical (median) lowest daily price of new and used GPUs on eBay, per month, or per week in the 6-month view. One-off mis-listed prices are filtered out.
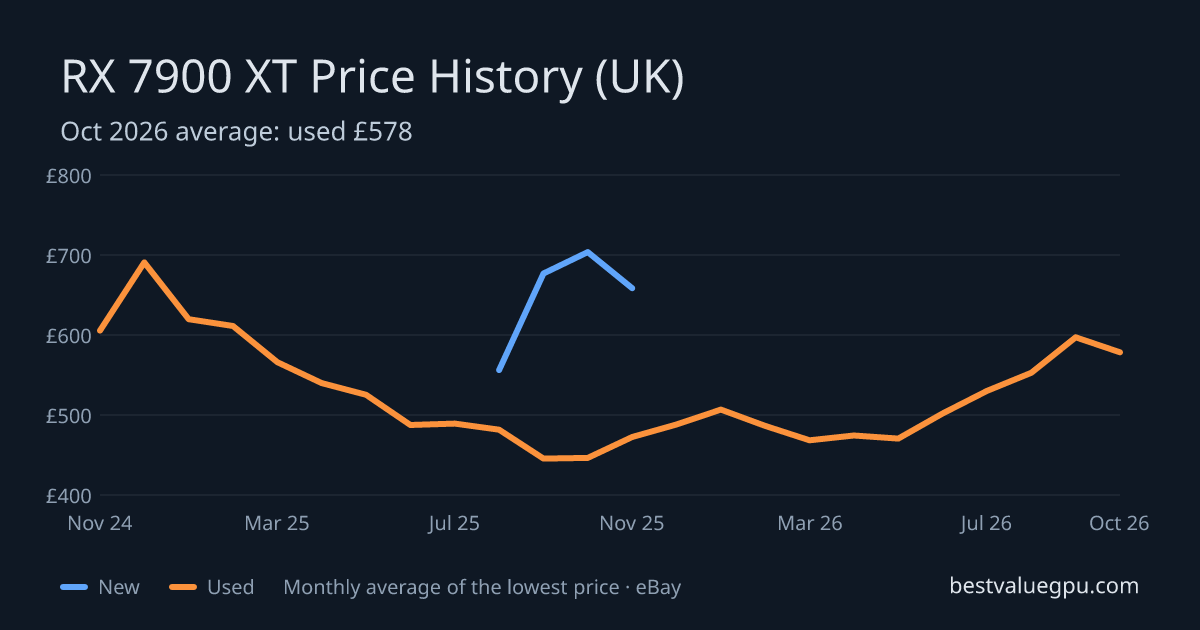
RX 7900 XT Price History Table
Typical (median) lowest daily price in each month, newest first. Δ is the change from the previous month in £.
| Month | New | Δ | Used | Δ |
|---|---|---|---|---|
| Oct 2026 | £660 | +69 | ||
| Sep 2026 | £591 | +41 | ||
| Aug 2026 | £550 | +21 | ||
| Jul 2026 | £529 | +53 | ||
| Jun 2026 | £476 | +10 | ||
| May 2026 | £466 | −9 | ||
| Apr 2026 | £475 | +9 | ||
| Mar 2026 | £466 | −24 | ||
| Feb 2026 | £490 | −20 | ||
| Jan 2026 | £510 | +23 | ||
| Dec 2025 | £487 | +19 | ||
| Nov 2025 | £701 | −1 | £468 | +44 |
Show 25 earlier months (Oct 2023 – Oct 2025)
| Oct 2025 | £702 | +2 | £424 | −23 |
| Sep 2025 | £700 | +152 | £447 | −32 |
| Aug 2025 | £548 | £479 | −13 | |
| Jul 2025 | £492 | +1 | ||
| Jun 2025 | £491 | −43 | ||
| May 2025 | £534 | −4 | ||
| Apr 2025 | £538 | −29 | ||
| Mar 2025 | £567 | −61 | ||
| Feb 2025 | £628 | +19 | ||
| Jan 2025 | £609 | −141 | ||
| Dec 2024 | £750 | +165 | ||
| Nov 2024 | £585 | +10 | ||
| Oct 2024 | £575 | −33 | ||
| Sep 2024 | £608 | −32 | ||
| Aug 2024 | £640 | +40 | ||
| Jul 2024 | £600 | −30 | ||
| Jun 2024 | £630 | +15 | ||
| May 2024 | £615 | −35 | ||
| Apr 2024 | £650 | 0 | ||
| Mar 2024 | £650 | −49 | ||
| Feb 2024 | £699 | −21 | ||
| Jan 2024 | £720 | −30 | ||
| Dec 2023 | £750 | 0 | ||
| Nov 2023 | £750 | −50 | ||
| Oct 2023 | £800 |
Is RX 7900 XT Worth It?
In the used market, the Radeon RX 7900 XT fails to justify its value for money. It lags behind the Radeon RX 9070 XT which outperforms it by a lead of 17.1% in 3DMark benchmark.
PSU for RX 7900 XT
Recommended PSU for the RX 7900 XT: about 900 W — the card draws 315 W, a CPU such as the Intel Core i9-13900K about 125 W, and doubling the total leaves headroom for transient spikes. Pick a unit from a reputable tier of the Cultists Network PSU Tier List.