Nvidia GeForce GTX 1660 SUPER
GTX 1660 SUPER Price History & Tracker (CA)
Price History Chart
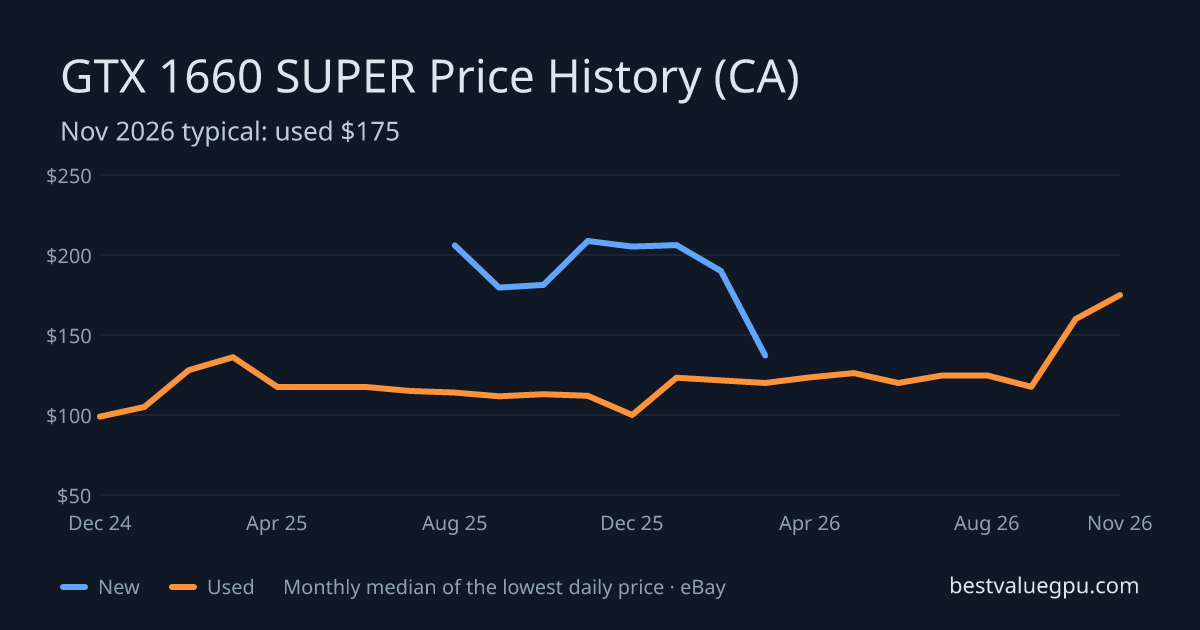
The chart shows the typical (median) lowest daily price of new and used GPUs on eBay, per month, or per week in the 6-month view. One-off mis-listed prices are filtered out.
GTX 1660 SUPER Price History Table
Typical (median) lowest daily price in each month, newest first. Δ is the change from the previous month in $.
| Month | New | Δ | Used | Δ |
|---|---|---|---|---|
| Nov 2026 | $175 | +15 | ||
| Oct 2026 | $160 | +42 | ||
| Sep 2026 | $118 | −7 | ||
| Aug 2026 | $125 | 0 | ||
| Jul 2026 | $125 | +5 | ||
| Jun 2026 | $120 | −7 | ||
| May 2026 | $127 | +3 | ||
| Apr 2026 | $124 | +4 | ||
| Mar 2026 | $138 | −52 | $120 | −2 |
| Feb 2026 | $190 | −17 | $122 | −2 |
| Jan 2026 | $207 | +1 | $124 | +24 |
| Dec 2025 | $206 | −3 | $100 | −12 |
Show 21 earlier months (Mar 2024 – Nov 2025)
| Nov 2025 | $209 | +27 | $112 | −1 |
| Oct 2025 | $182 | +2 | $113 | +1 |
| Sep 2025 | $180 | −27 | $112 | −2 |
| Aug 2025 | $207 | $114 | −1 | |
| Jul 2025 | $115 | −3 | ||
| Jun 2025 | $118 | 0 | ||
| May 2025 | $118 | 0 | ||
| Apr 2025 | $118 | −19 | ||
| Mar 2025 | $137 | +9 | ||
| Feb 2025 | $128 | +23 | ||
| Jan 2025 | $105 | +6 | ||
| Dec 2024 | $99 | −26 | ||
| Nov 2024 | $125 | +35 | ||
| Oct 2024 | $90 | 0 | ||
| Sep 2024 | $90 | −35 | ||
| Aug 2024 | $125 | −5 | ||
| Jul 2024 | $130 | −5 | ||
| Jun 2024 | $135 | +10 | ||
| May 2024 | $125 | −16 | ||
| Apr 2024 | $141 | −8 | ||
| Mar 2024 | $149 |
Benchmark
Big thanks to Random Benchmark for the video!